August 19th, This week/next week will be the bottom.
I can't predict at what price, but somewhere in the 2.70-3.05 range I believe IMO.
ROUNDING BOTTOM???
I was looking at the futures and I saw this pattern on the 1 minute chart..
Like the rounding top, rounding bottom patterns are almost deceptively simple in nature. They are all about the orderly transfer of shares from anxious sellers to serious, value minded longer-term investors. Through a series of peaks and valleys sellers are slowly (almost painfully so) removed. The first part of the pattern will always take shape after an extended decline to new lows. Against the backdrop of very negative fundamental news, sellers become anxious and willing to sell their shares for progressively lower prices.
I would not take this pattern seriously.. however. it is fun and interesting to note that they are many bottoming patterns showing up on the charts, which may suggest a bottom to occur (I do not know the exact, date & price, I am just showing what the charts are saying... I do believe that sub $3.00 is possible.. so I cannot discount that either).
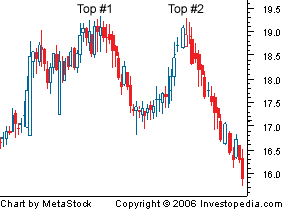
Double Top is taking place.
Trend: Bearish
Price Targets for bottoms: 2.974..or 2.70 where is this number derived? Check today's chart.
Position: Scaling into longs.
Chart1 :
Notice the double top, and the target area. Also see how the 3.4-4.0$ range is a trading range for NG. We never really stay in that range for too long. We either go above it, or below it.. Tomorrow's NG report should be predictive of NG overall trend. If it is bearish.. jeez.... who knows then??
Chart 2: Notice we are sitting on support (the black trendline). Here is my prediction.
Why are NG prices falling?
We had some sort of fictitious price movement a couple of weeks ago with 2 10% up days. These quickly corrected itself, and the real downtrend started at around 3.40. Also, the economy is in question, with equities falling, so will Natural Gas. Lastly, I believe Natural Gas is in the bottoming process..
If equities hold today, so will natural gas.
Natural gas needs to breakout of it's daily channel trend for me to start saying we've bottomed. Good luck, the RSI is there to support a bottom, but how many days do we have left? I believe very little. Average down if you can.
Some can argue we are in an ending diagonal which will throw people off.
"An ending diagonal is a special type of wave that occurs primarily in the fifth wave position at times when the preceding move has gone 'too far too fast,' as Elliott put it. In all cases, they are found at the termination points of larger patterns, indicating exhaustion of the larger movement."
Don't belive the hype of analysts. This is a great buying opportunity if you can take some 20-30% pain [maximum]. (Think of this situation like march, 9th 2009 when the equity markets bottomed.. no one was sure where it was bottoming, but equities were at a really good price.. so is natural gas in the long-run.. thing is the ETFs have contango and just plain suck.).
We analyze companies in terms of long-term return potential and invest in them only when their stock is trading at a discount to intrinsic value. This approach allows us to minimize transaction fees and contributes to reduce the tax impact of capital gains.


